
Description
Tradply is a trade journal and performance dashboard built in Google Sheets. Log each trade in a single row — account, symbol, market, position, strategy, entry, stop, exit and commission — and the journal works out the rest.
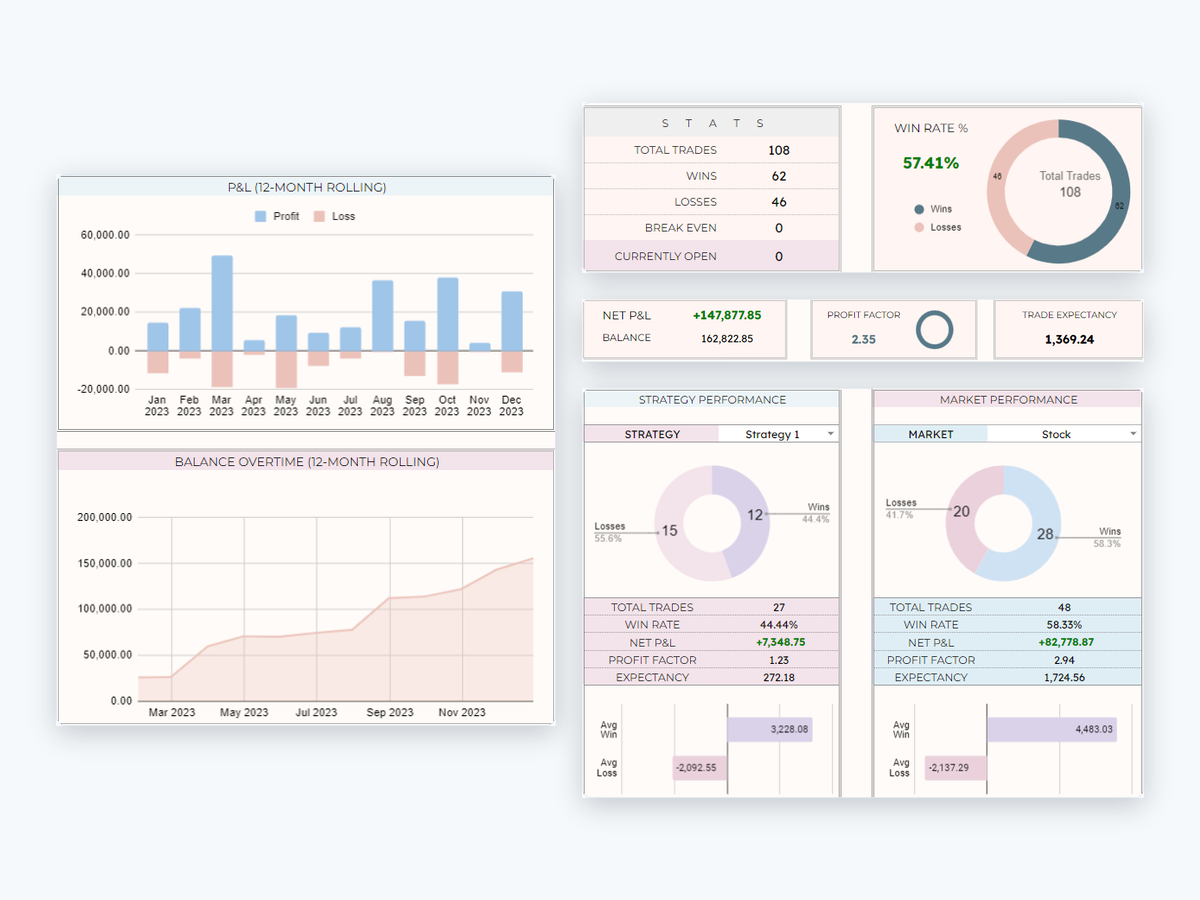
The dashboard reports net P&L, balance, win rate, profit factor and trade expectancy, and can be filtered by account and date range. Each trade also gets an R-multiple, a risk-reward ratio, a hold duration and a P&L percentage. Performance is broken down by strategy and by market, so you can see which approach is actually paying rather than one blended number.
Alongside it there is a sortable, filterable registry of your whole history, a monthly profit calendar with weekly totals, and a live watchlist carrying current price, day change, volume and year-to-date return for indices, crypto and your own tickers. You can run up to thirty accounts, markets and strategies in the currency of your choice.
After payment you receive a link to make your own copy of the sheet into your Google Drive. It stays yours — we do not read it, and it works on desktop or in the Google Sheets mobile app.
This is a one-time payment for the access term shown. Nothing renews automatically and there is no subscription to cancel.
Tradply is a record-keeping and educational tool only. It is not financial, investment, or trading advice.
Prices exclude VAT and sales tax. Stripe adds any tax due for your country at checkout.